Solar Basics
Where the annual yield figure in a quotation comes from
A predicted generation number is a model output built from historical weather, a geometric shading assessment and a chain of assumed losses, and each of those carries its own error.
By Daniel Okonkwo4 min read

A prediction is a calculation, and it has ingredients
Every quotation carries a single number for expected annual generation, usually stated to the nearest unit of energy, and the precision of that presentation is misleading. It is the output of a chain of calculations, and understanding the chain is what allows you to judge whether two competing quotations are actually disagreeing about anything.
The chain has four links. A source of historical solar radiation data for the location, a geometric model of the array and its obstructions, a conversion from incoming light to module output, and a set of loss factors applied afterwards. Errors in each of them combine, and they do not conveniently cancel.
None of this makes the estimate useless. It makes it a range presented as a point.
The weather data is somebody else’s history
Solar resource datasets are assembled from ground stations, satellite observation or a blend of both, then processed into a representative year that is meant to stand in for typical conditions. That representative year is a construction rather than a record of anything that happened, and it deliberately smooths out the extremes that make real years interesting.
Two things follow. Any given real year will differ from the estimate, and a run of cloudy summers can put several consecutive years below the predicted figure without anything being wrong with the array. Judging a system against its first year alone is therefore a weak test.
The other issue is resolution. Satellite-derived data describes an area rather than a point, and in hilly terrain, near a coast or in a city with its own microclimate, the grid square containing your house may not describe your house.
The geometry is the part most likely to be skipped
Converting horizontal radiation figures into what lands on a tilted plane is standard mathematics involving the sun position, the array orientation and an assumption about how diffuse light is distributed across the sky. That last assumption is a model choice, and different models give slightly different answers for the same roof.
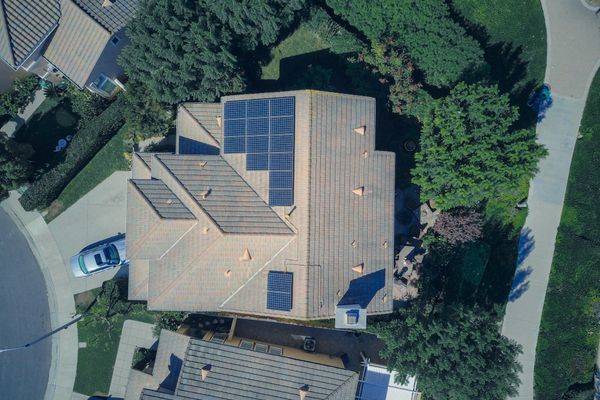
Shading is where estimates diverge most, because handling it properly means recording the horizon in every direction and calculating the loss hour by hour across the year. Done well, it is the most valuable part of the survey. Done badly, it is a percentage typed into a box by someone who looked at the roof from the pavement.
It is entirely reasonable to ask which it was. A quotation that includes a horizon profile or a shading diagram is telling you the work was done, and one that produces a confident figure for a roof with a chimney on it, without any such evidence, is telling you something too.
The losses are a stack of assumptions with one name
Between the light hitting the glass and the energy arriving at the meter there is a series of deductions: module temperature, mismatch between panels, resistance in the cabling, inverter conversion, soiling, and the difference between the module tested at the factory and the module actually delivered. Traditionally these are bundled into a single overall factor.
That bundling is convenient and it hides a lot. Two designers using different assumptions for the same roof produce different annual figures without either being wrong, and the gap can be larger than the difference between the panel products they are proposing.
The temperature deduction is the one worth asking about specifically, because it varies with mounting method and climate rather than being a constant. An in-roof installation in a hot region and a well-ventilated array in a cool one do not deserve the same number.
How to use the figure without being misled by it
The estimate is best treated as a central value with meaningful uncertainty on either side, and its most useful application is comparative rather than absolute. If three quotations for the same roof produce figures within a narrow band, that band is probably where reality sits. If one is markedly higher, the interesting question is which assumption it changed.
Ask what software produced it, what dataset it used and what shading input it was given. Those three answers explain almost every discrepancy you will encounter, and a competent designer will give them without hesitation.
And treat a strikingly optimistic estimate as information about the supplier rather than about the roof. The sun over your house is the same in all three documents.
What the first years will actually show
Real generation wanders around the prediction, driven mostly by weather, and a meaningful comparison needs several years rather than one. A single low year proves nothing. A consistent shortfall of the same shape in every month, particularly in the seasons when shading is worst, is a genuine signal worth pursuing.
Keep the estimate and the assumptions behind it somewhere findable. If a dispute ever arises about performance, the document that says what was assumed is worth considerably more than the one that states a number.
Common questions
My system produced less than the quote said in its first year. Is something wrong?
Possibly, but a single year is weak evidence, because the prediction describes a typical year rather than any specific one and real weather varies substantially around it. The stronger test is the shape of the shortfall: a deficit spread evenly across every month suggests weather or a modelling assumption, while a deficit concentrated in particular hours or seasons points towards shading or a fault.
Why do two installers give different generation figures for the same roof?
Almost always because they used different loss assumptions, different weather datasets or different shading inputs, rather than because they disagree about the equipment. Asking each of them which software and which shading method they used usually explains the gap in one sentence.
Does the estimate account for panels getting older?
Some do and some do not, and it is worth asking. An estimate for the first year of operation and an estimate averaged across the system life are different numbers, because output declines slowly over decades. If a document does not say which convention it uses, it cannot fairly be compared with one that does.
Editor, Power Your Roof
Daniel writes the explanatory pieces on solar basics, batteries, bills & tariffs and is unreasonably interested in the detail nobody else checks.